

Analytics for Launch
The Launch Analytics page provides detailed insights into the progress of your deployment projects. By analyzing key metrics like execution times, project environments, and API performance, you can optimize deployments and make informed, data-driven decisions.
Estimated reading time: 4 minutes
Skill level: Intermediate
Prerequisites
- Contentstack account
- Organization Owner or Admin permissions
What You Will Learn
-
How to navigate to the Launch Analytics dashboard using the App Switcher.
-
What each dashboard section measures and how to use it.
-
How to apply filters, group data, and save custom views.
Access the Launch Analytics Dashboard
To access the Analytics dashboard, log in to your Contentstack account and perform the following steps:
-
Navigate to Analytics through the "App Switcher".
-
By default, the CMS analytics dashboard appears. Click Launch to switch to the Launch dashboard.
Note: The data in the Launch dashboard is updated every 24 hours.
Launch Analytics Dashboard Sections
The dashboard is divided into several sections, each offering insights into different areas of Launch usage and helping optimize performance and efficiency.
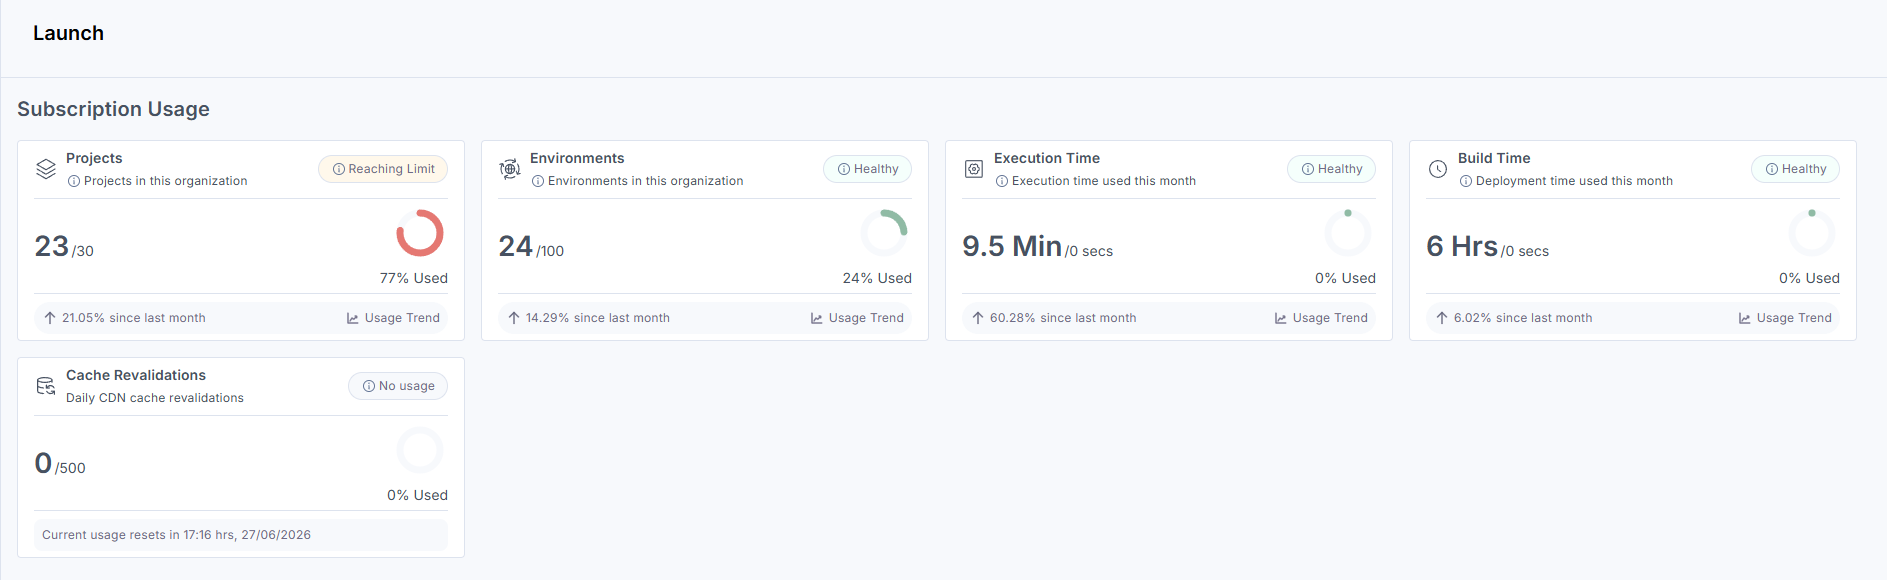
Subscription Usage
Displays your current Launch resource consumption, including the number of projects, environments, execution time, build time, and cache revalidations. Use this section to track usage against your subscription limits.
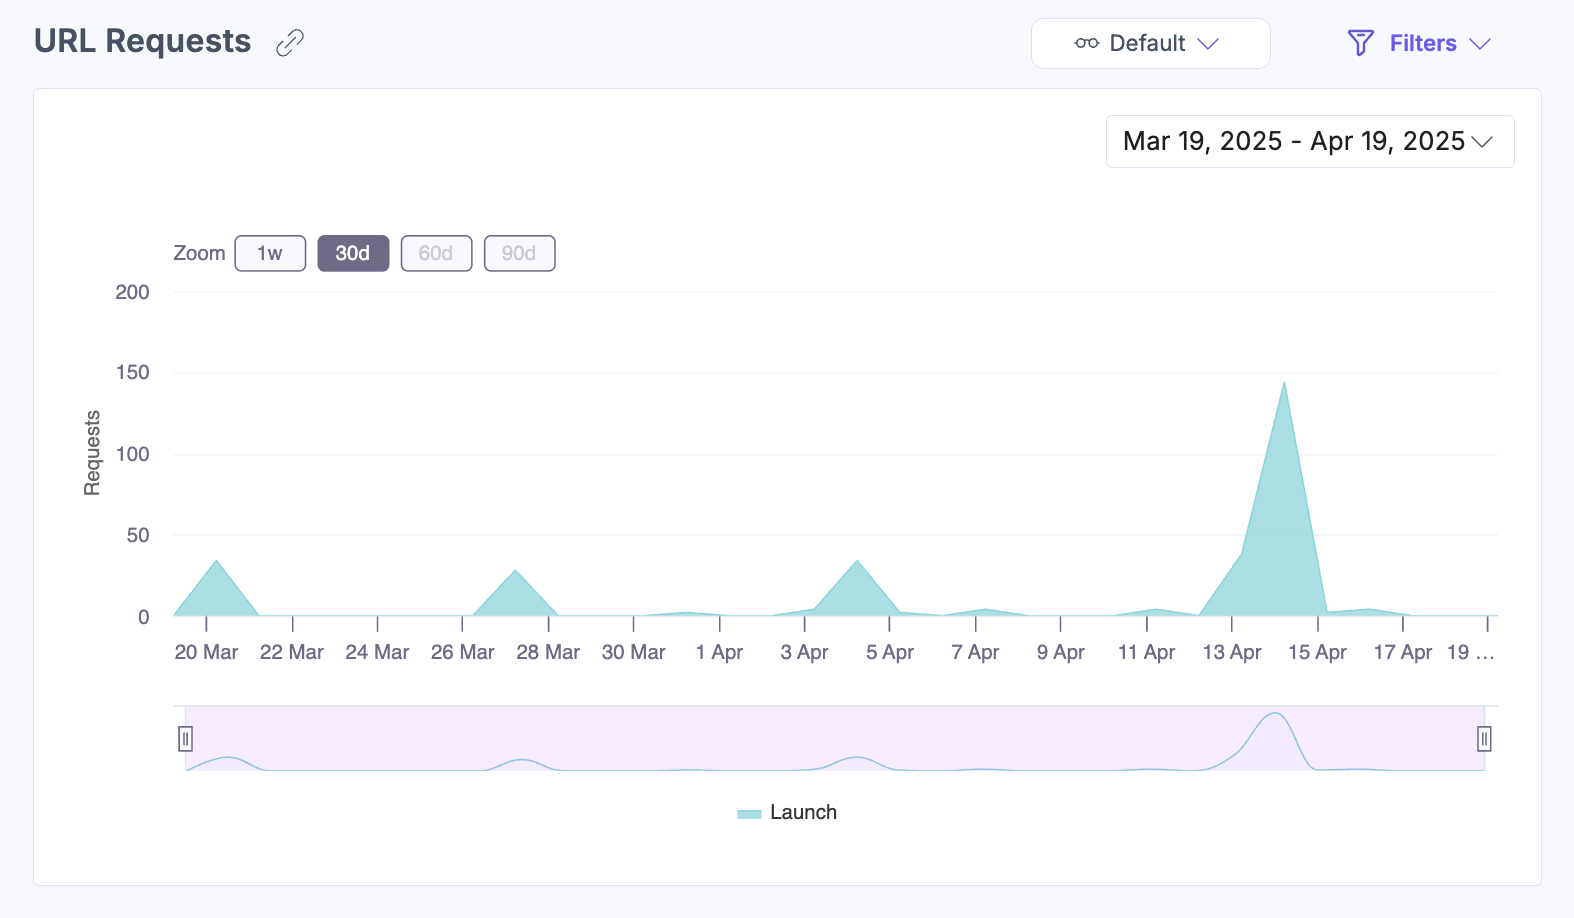
URL Requests
Displays a time-based graph of URL request volume and frequency. Hover over the chart to see metrics for a specific timestamp.
Bandwidth Usage
Tracks bandwidth consumption over time. Hover over the chart to view bandwidth details for a specific timestamp.

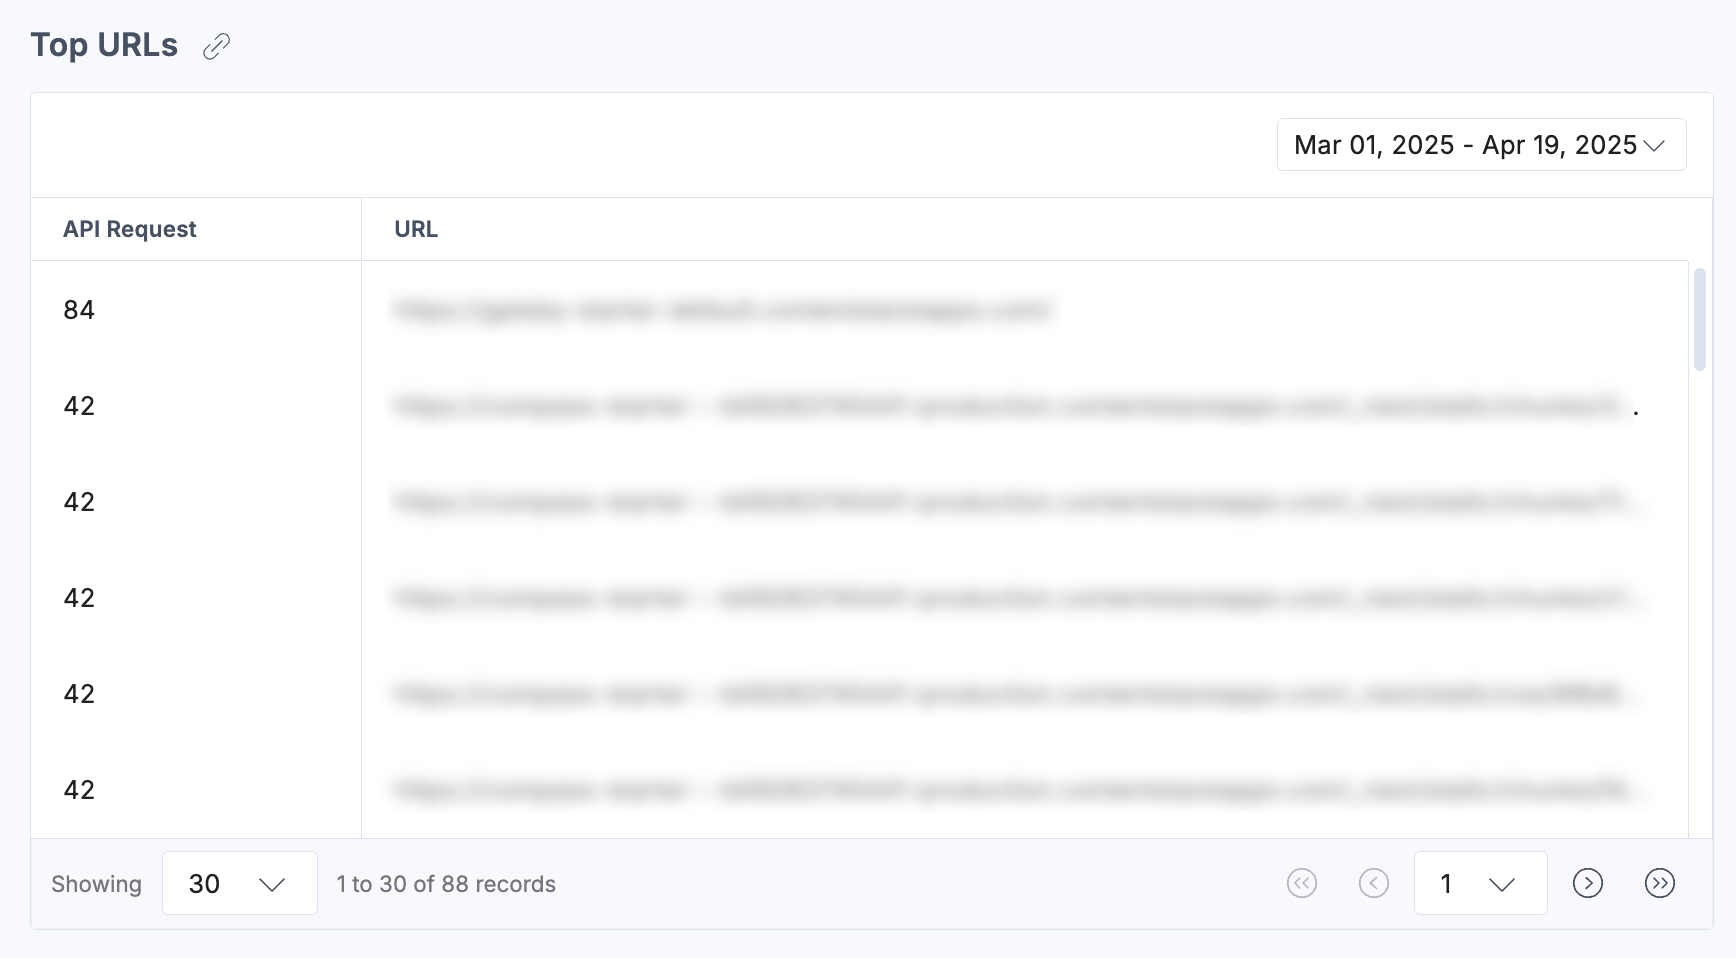
Top URLs
Lists the most frequently accessed API endpoints within Launch. Use this section to identify usage trends and find candidates for performance optimization.
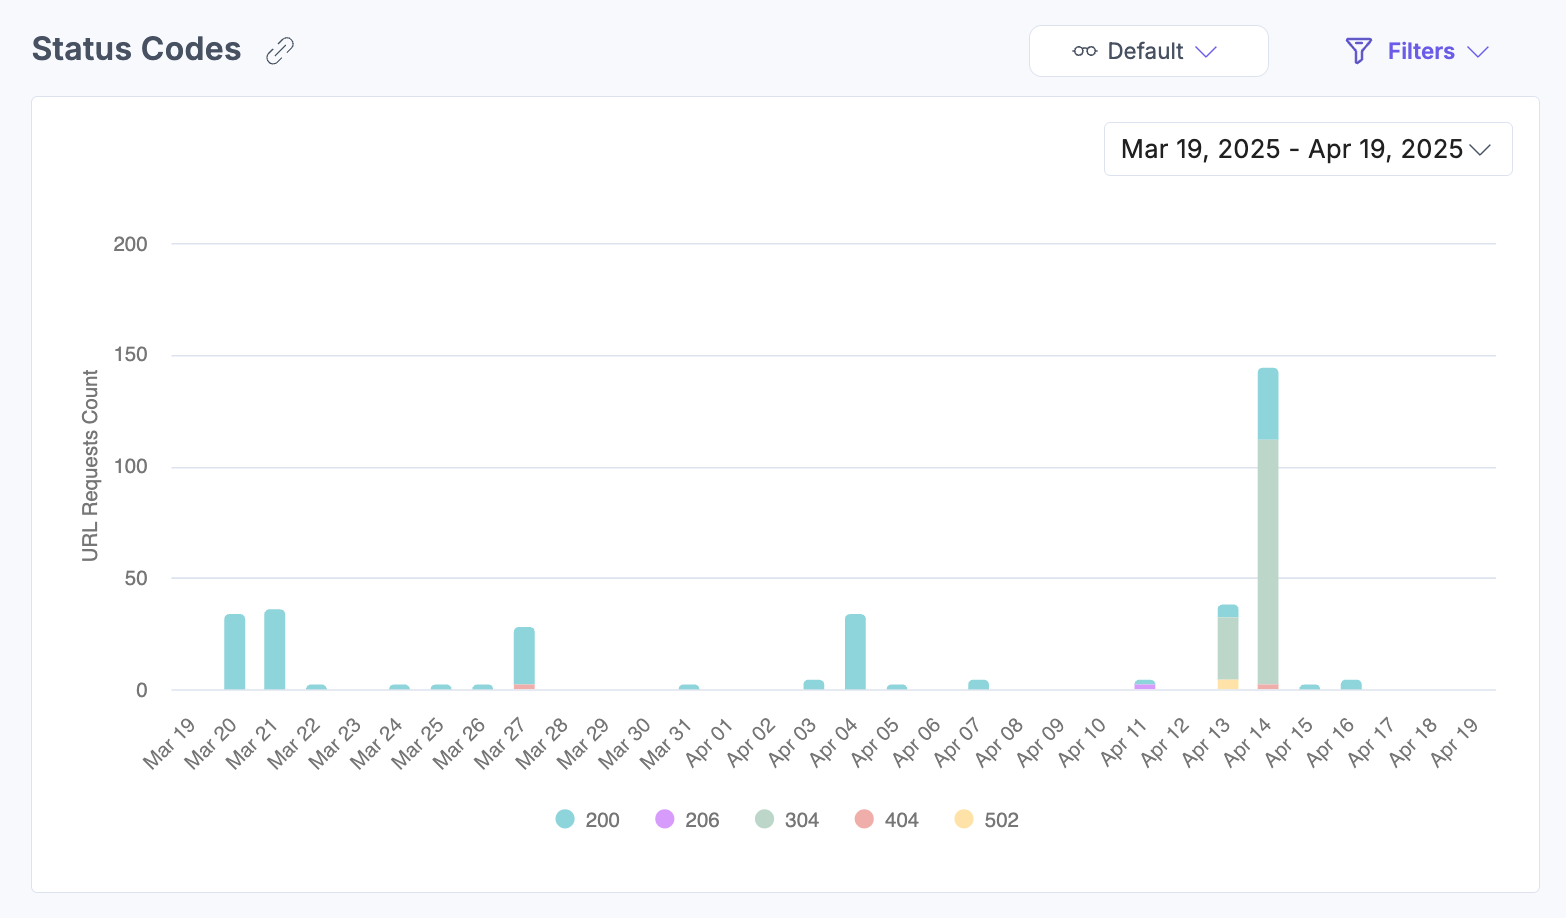
Status Codes
Breaks down URL request results by HTTP status code, including successes, errors, and unsupported requests. Use this section to support diagnostics and identify patterns in request failures.
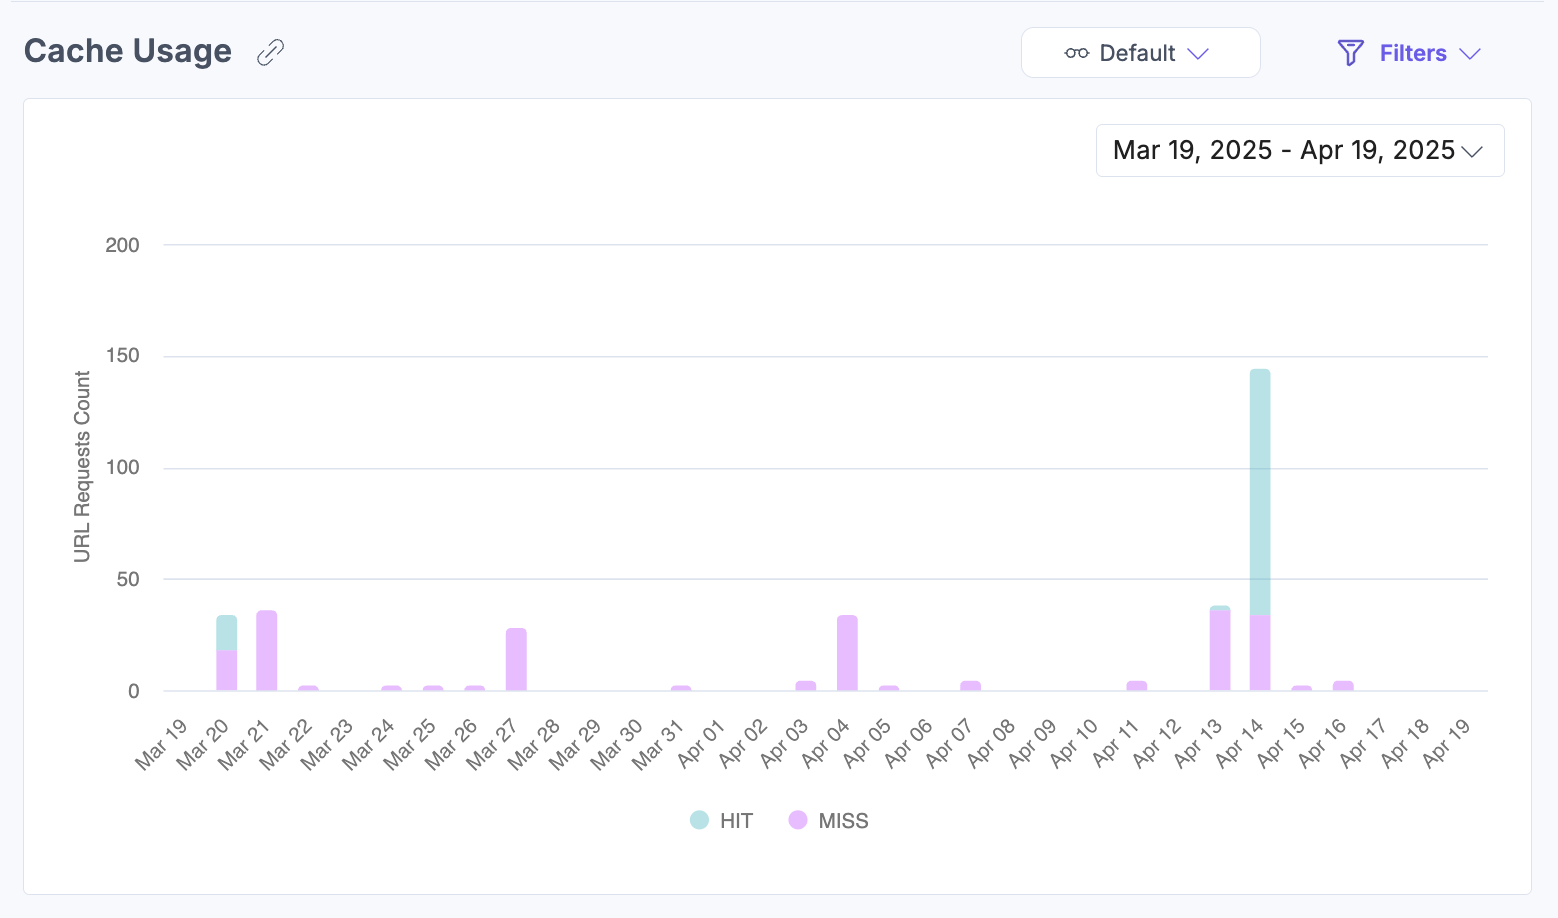
Cache Usage
Shows hit and miss ratios for cached responses. Use this section to evaluate your cache configuration and identify opportunities to improve load times.
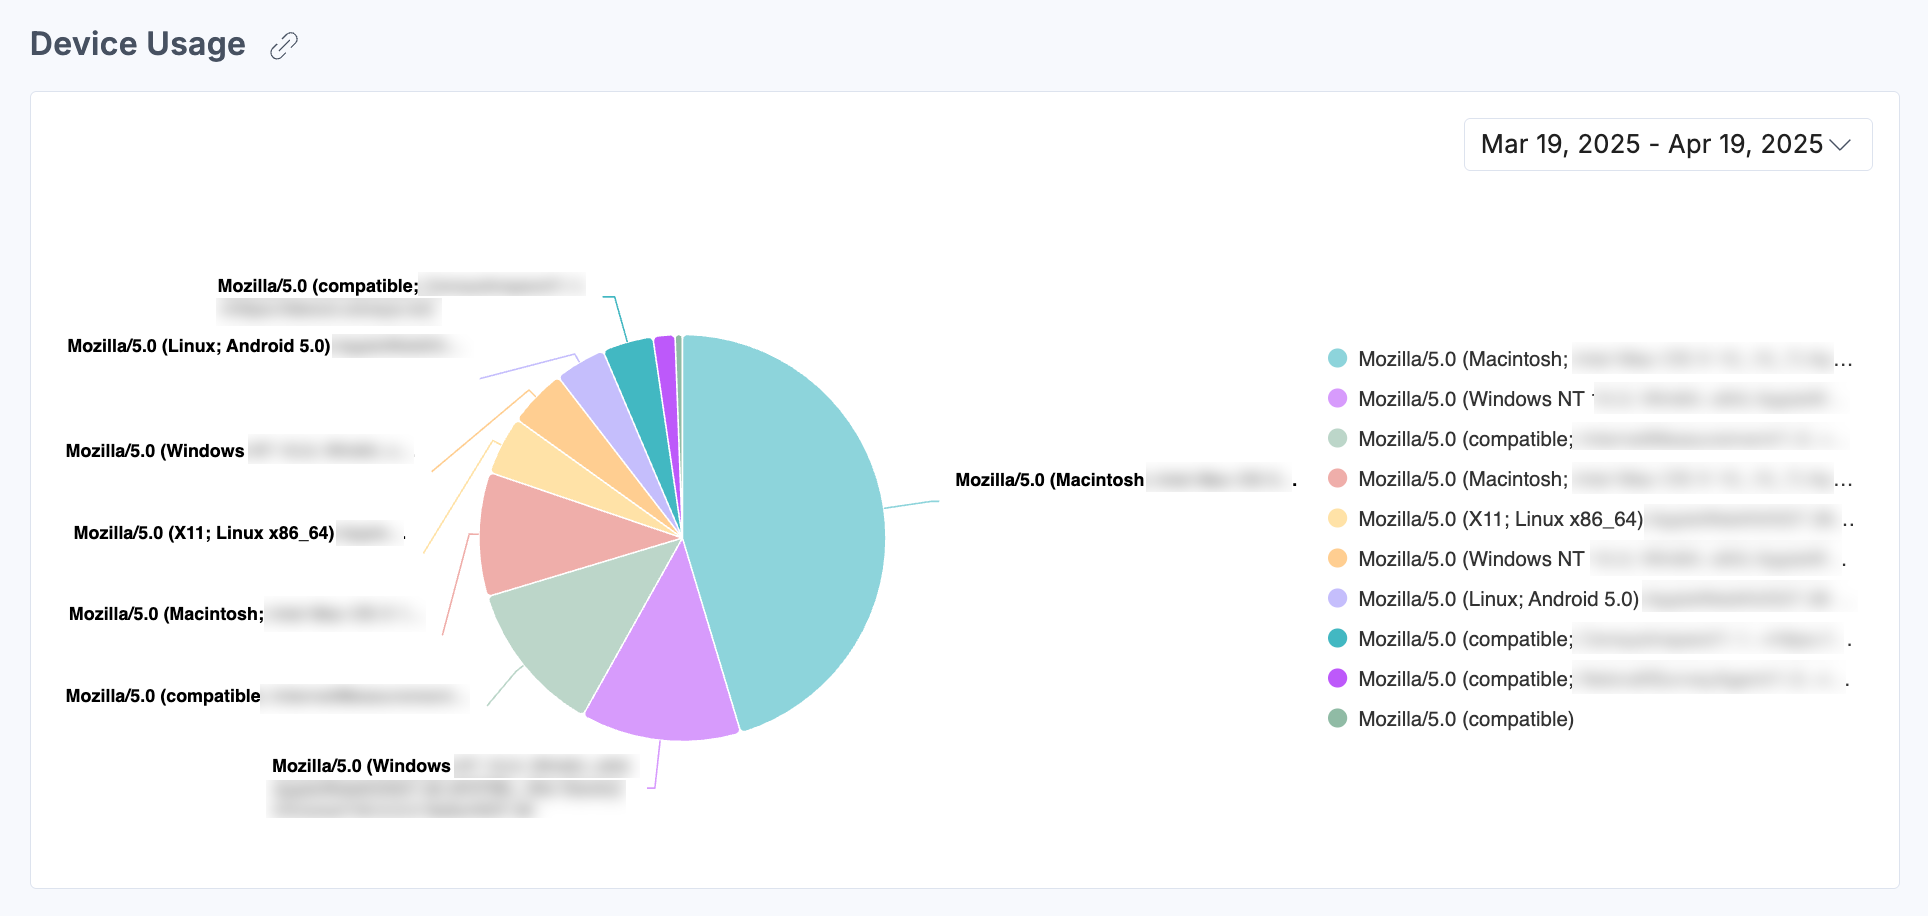
Device Usage
Displays a pie chart showing the breakdown of devices accessing Launch. Use this section to understand traffic sources and inform decisions about UI optimization for specific device types.
By leveraging the Analytics dashboard, you gain actionable insights to optimize deployments, improve system efficiency, and maximize the value of Contentstack Launch.
Apply Filters and Manage Views
To apply filters, click Filters, select your desired options, and then click Apply Filter(s).
The following filters are available:
-
Projects: View metrics for a specific project or for all projects together.
-
Environments: Filter data for specific environments or for all environments.
-
Status Code: Filter by specific HTTP response codes.
-
Cache: Filter by HITs or MISSes.
-
Group By: View data grouped by day, week, or month.
-
Date Range: Choose from 1 week, 30 days (default), 60 days, or 90 days. Some charts include a timeline selector for further refinement.
-
Custom Date: Set a custom date range using the dropdown.
Note: The custom date range must not exceed 90 days.
To save a specific filter for later use, click the horizontal ellipsis (...) beside Reset and select Save As New View.
The saved view appears in the dropdown menu so you can reapply it without re-entering the filter options each time.
Related Resources
-
Analytics API reference : retrieve Launch analytics data programmatically.
-
Launch API reference : manage Launch projects, environments, deployments, and cache revalidation via REST API.
-
About Launch : overview of Launch and its deployment capabilities.
More articles in "Work with Analytics"
