

Analytics for Automations
The Analytics dashboard for Automations is designed to provide comprehensive insights into the execution and performance of automation scripts within your organization. This tool allows you to monitor the efficiency and impact of automation by tracking various key metrics, ensuring that your automation processes are optimized for peak performance.
Prerequisites
- Contentstack account
- Organization Owner or Admin permissions
What You Will Learn
How to navigate to the Automations Analytics dashboard.
What each dashboard section displays and how to use it.
How to filter data by status code, time interval, and date range.
Access the Automations Analytics Dashboard
To access the analytics dashboard, log in to your Contentstack account and perform the following steps:
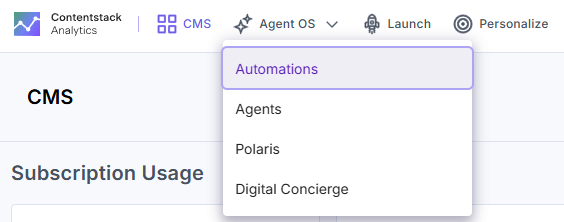
- Navigate to Analytics through the “App Switcher”.
- By default, the CMS analytics dashboard appears. Click Agent OS and then select Automations to switch dashboards.
Note: The data in the Automations dashboard is updated every 24 hours.
Automations Analytics Dashboard Sections
The dashboard is divided into several key sections, each providing valuable insights into different aspects of your Automations usage. These sections help you monitor and optimize your performance, resource utilization, and overall efficiency.
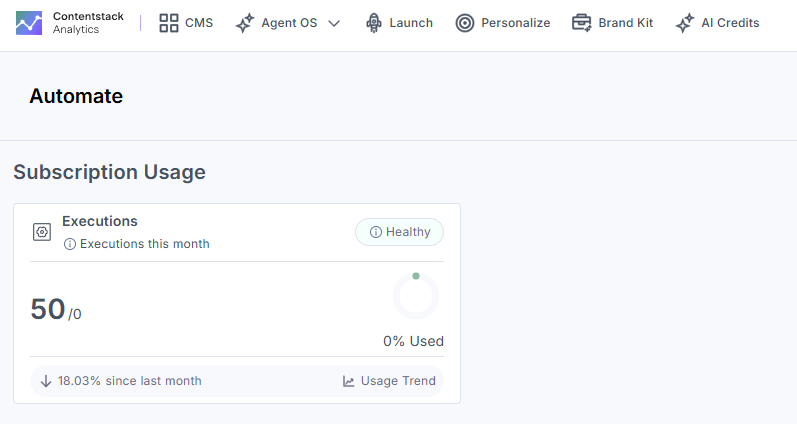
Subscription Usage
This section gives an overview of the execution usage, showing the number of executions performed in Automations, along with your organization’s set limit.
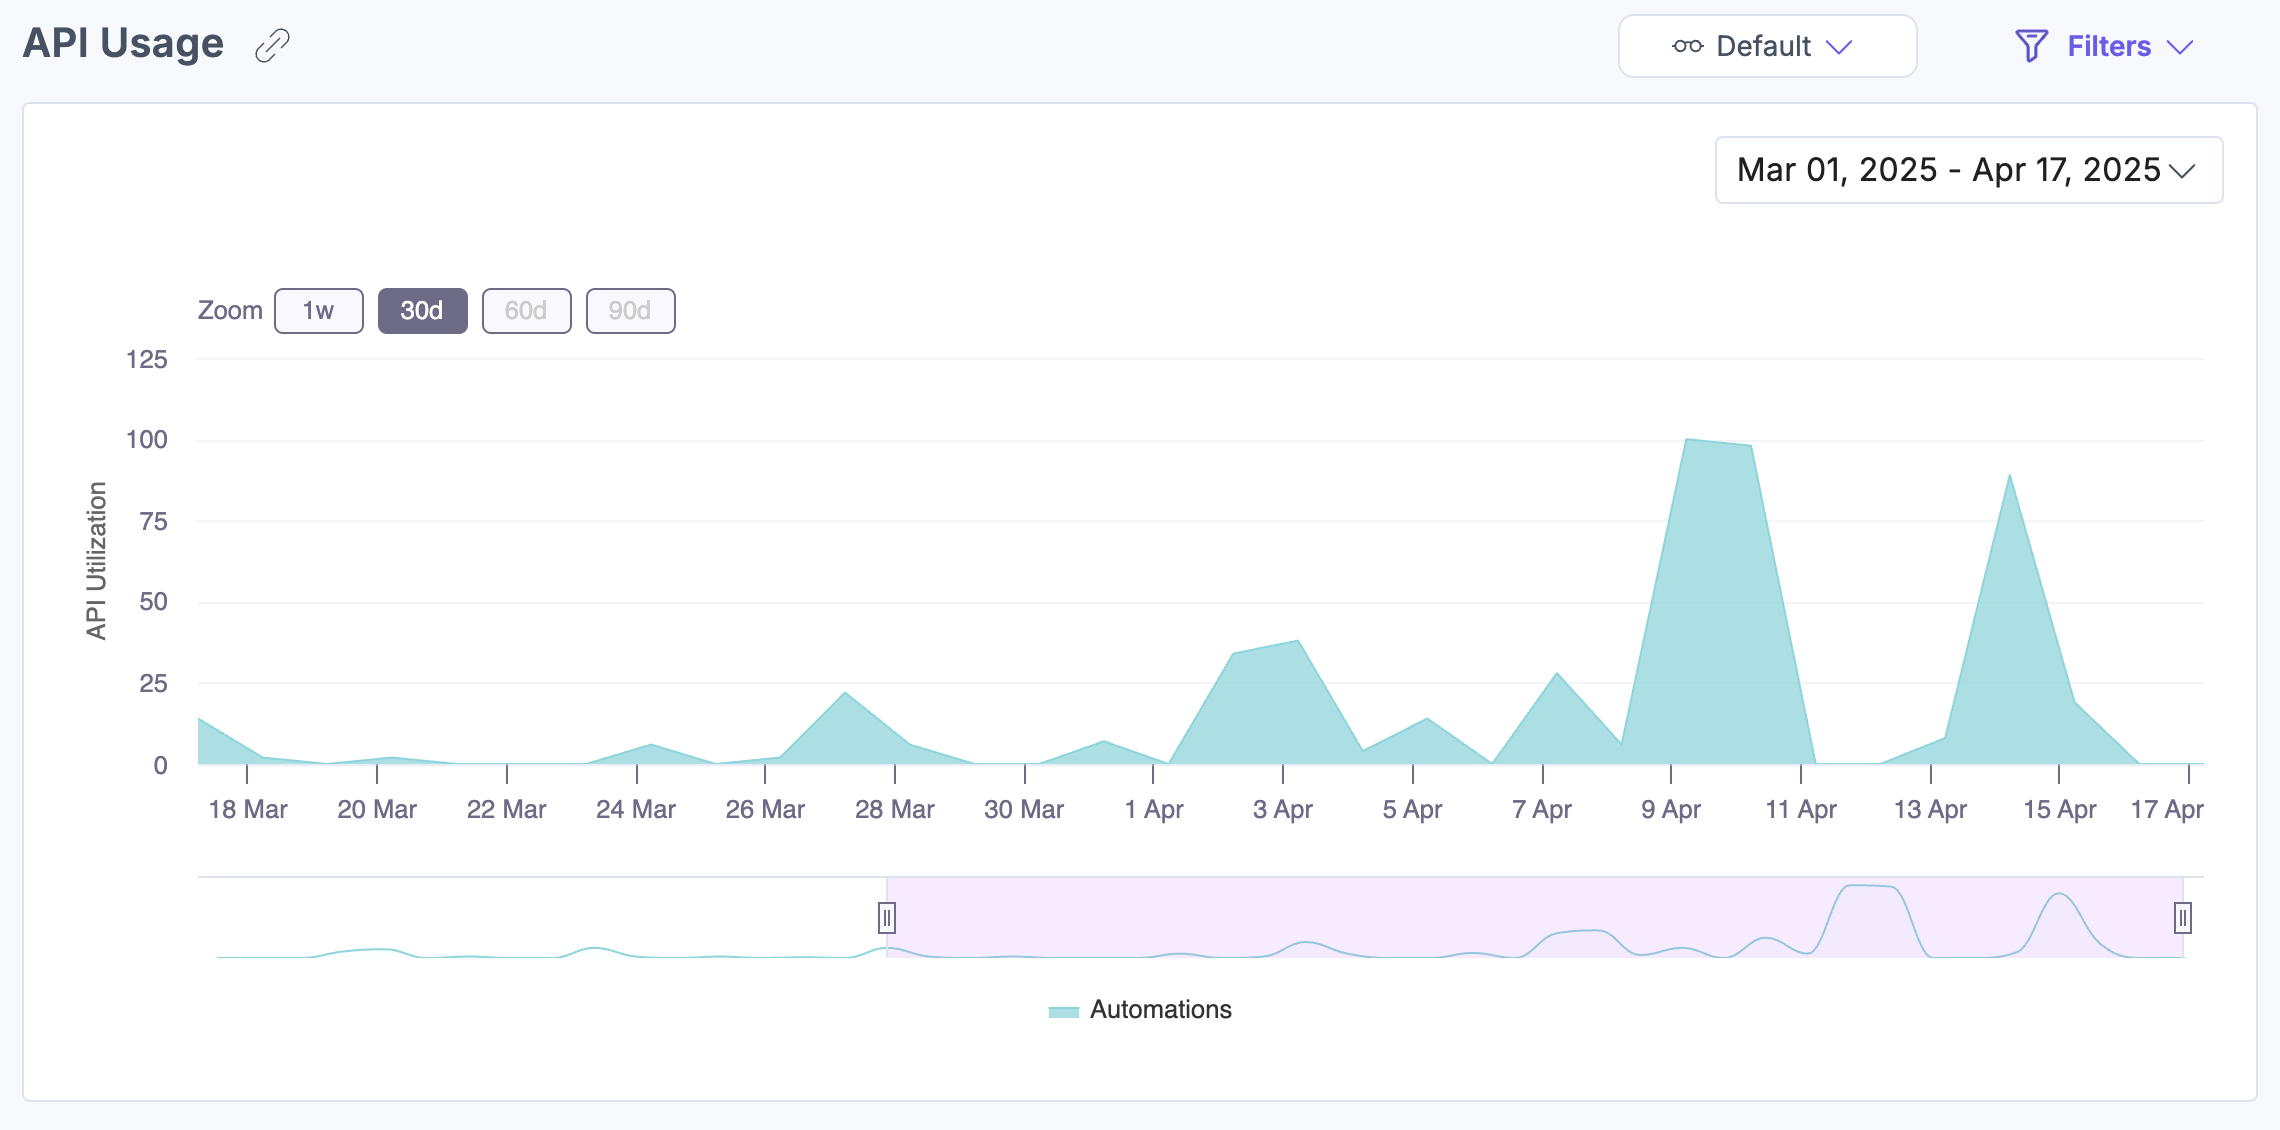
API Usage
The API Usage section features a visualization of API usage over a selected time frame. This visualization helps you monitor and analyze the volume and frequency of API calls within Automations. Hover anywhere over the chart to see the corresponding API utilization for a specific timestamp.
Bandwidth Usage
This section visually tracks bandwidth usage over time, helping you ensure that you stay within your subscription limits. Hover anywhere over the chart to see the corresponding bandwidth utilization for a specific timestamp.

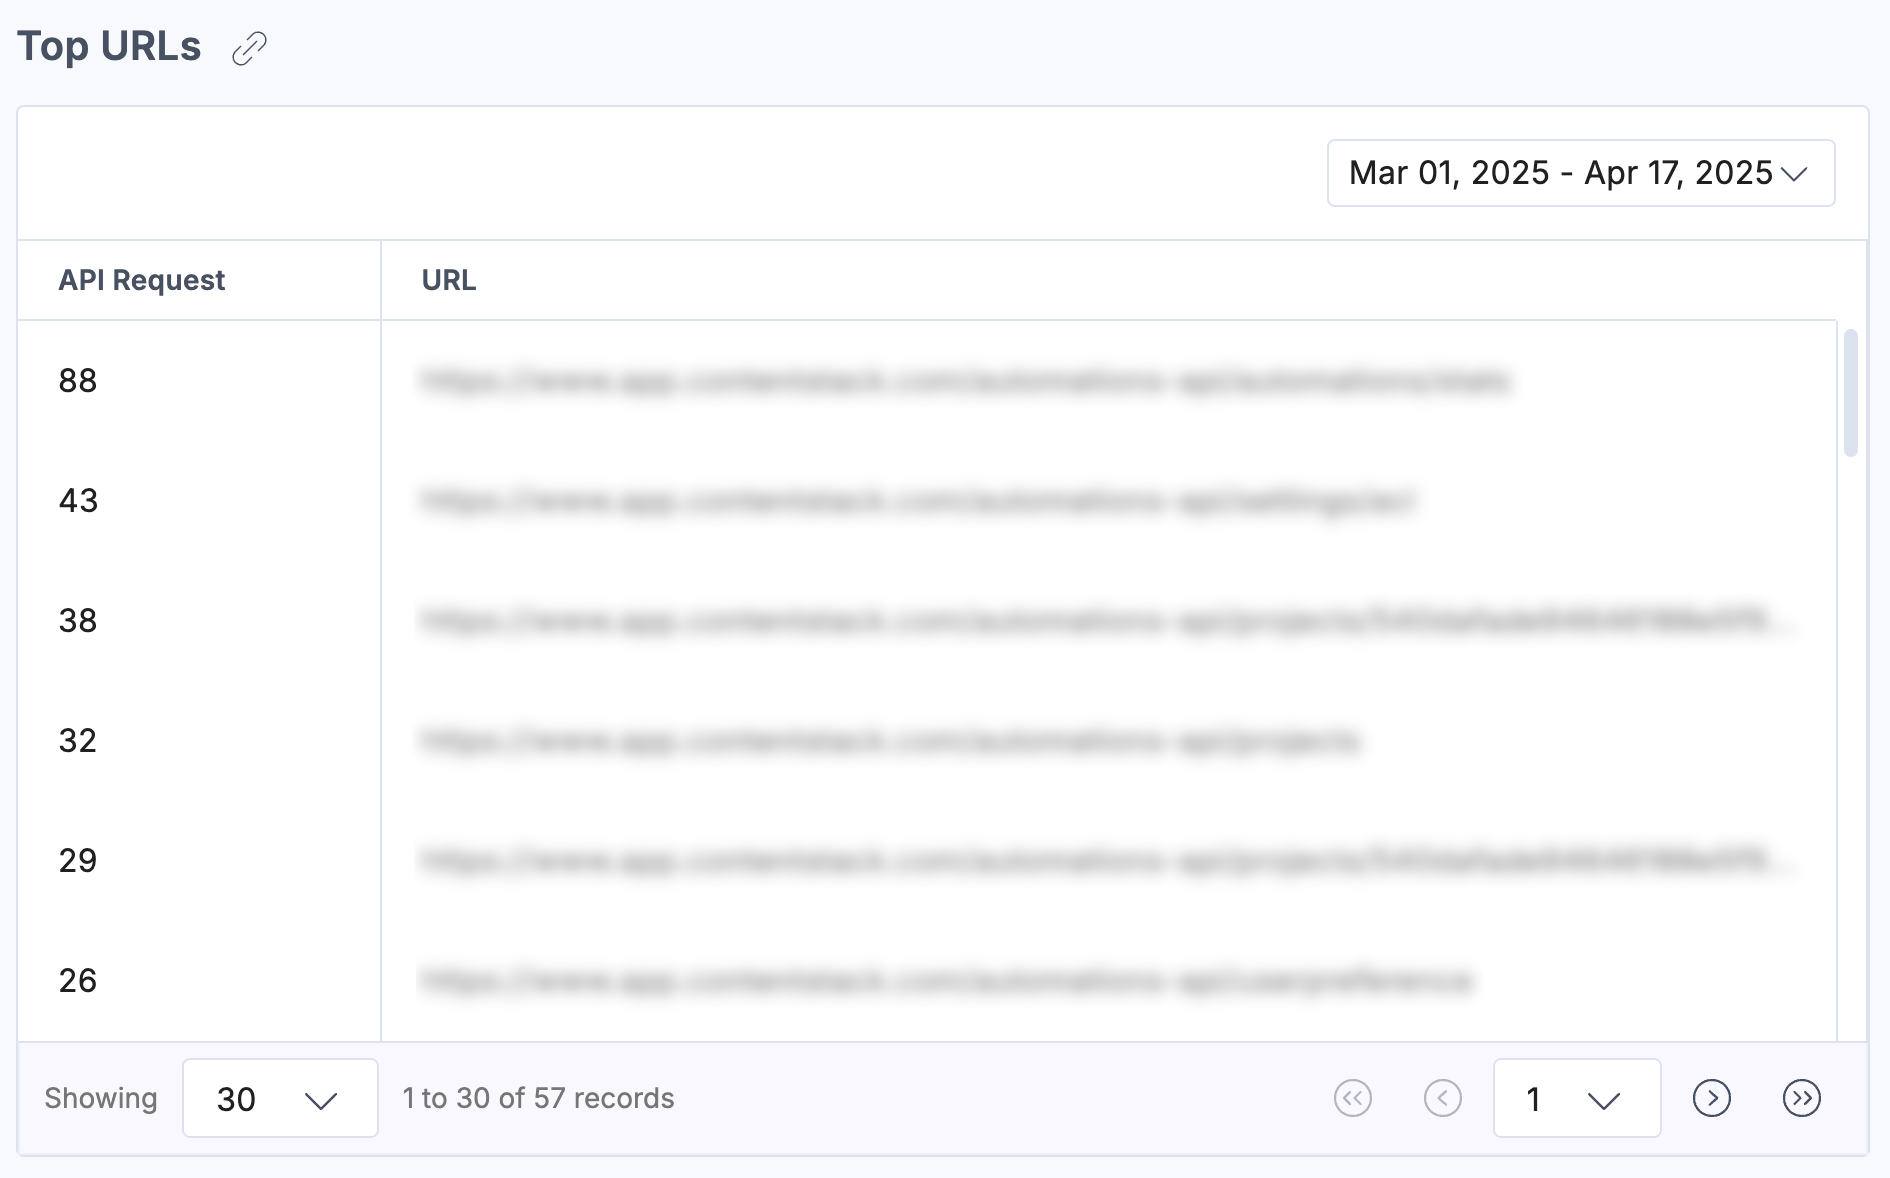
Top URLs
The Top URLs section displays the most frequently accessed API endpoints within Automations, helping you understand user interactions and optimize your system's performance.
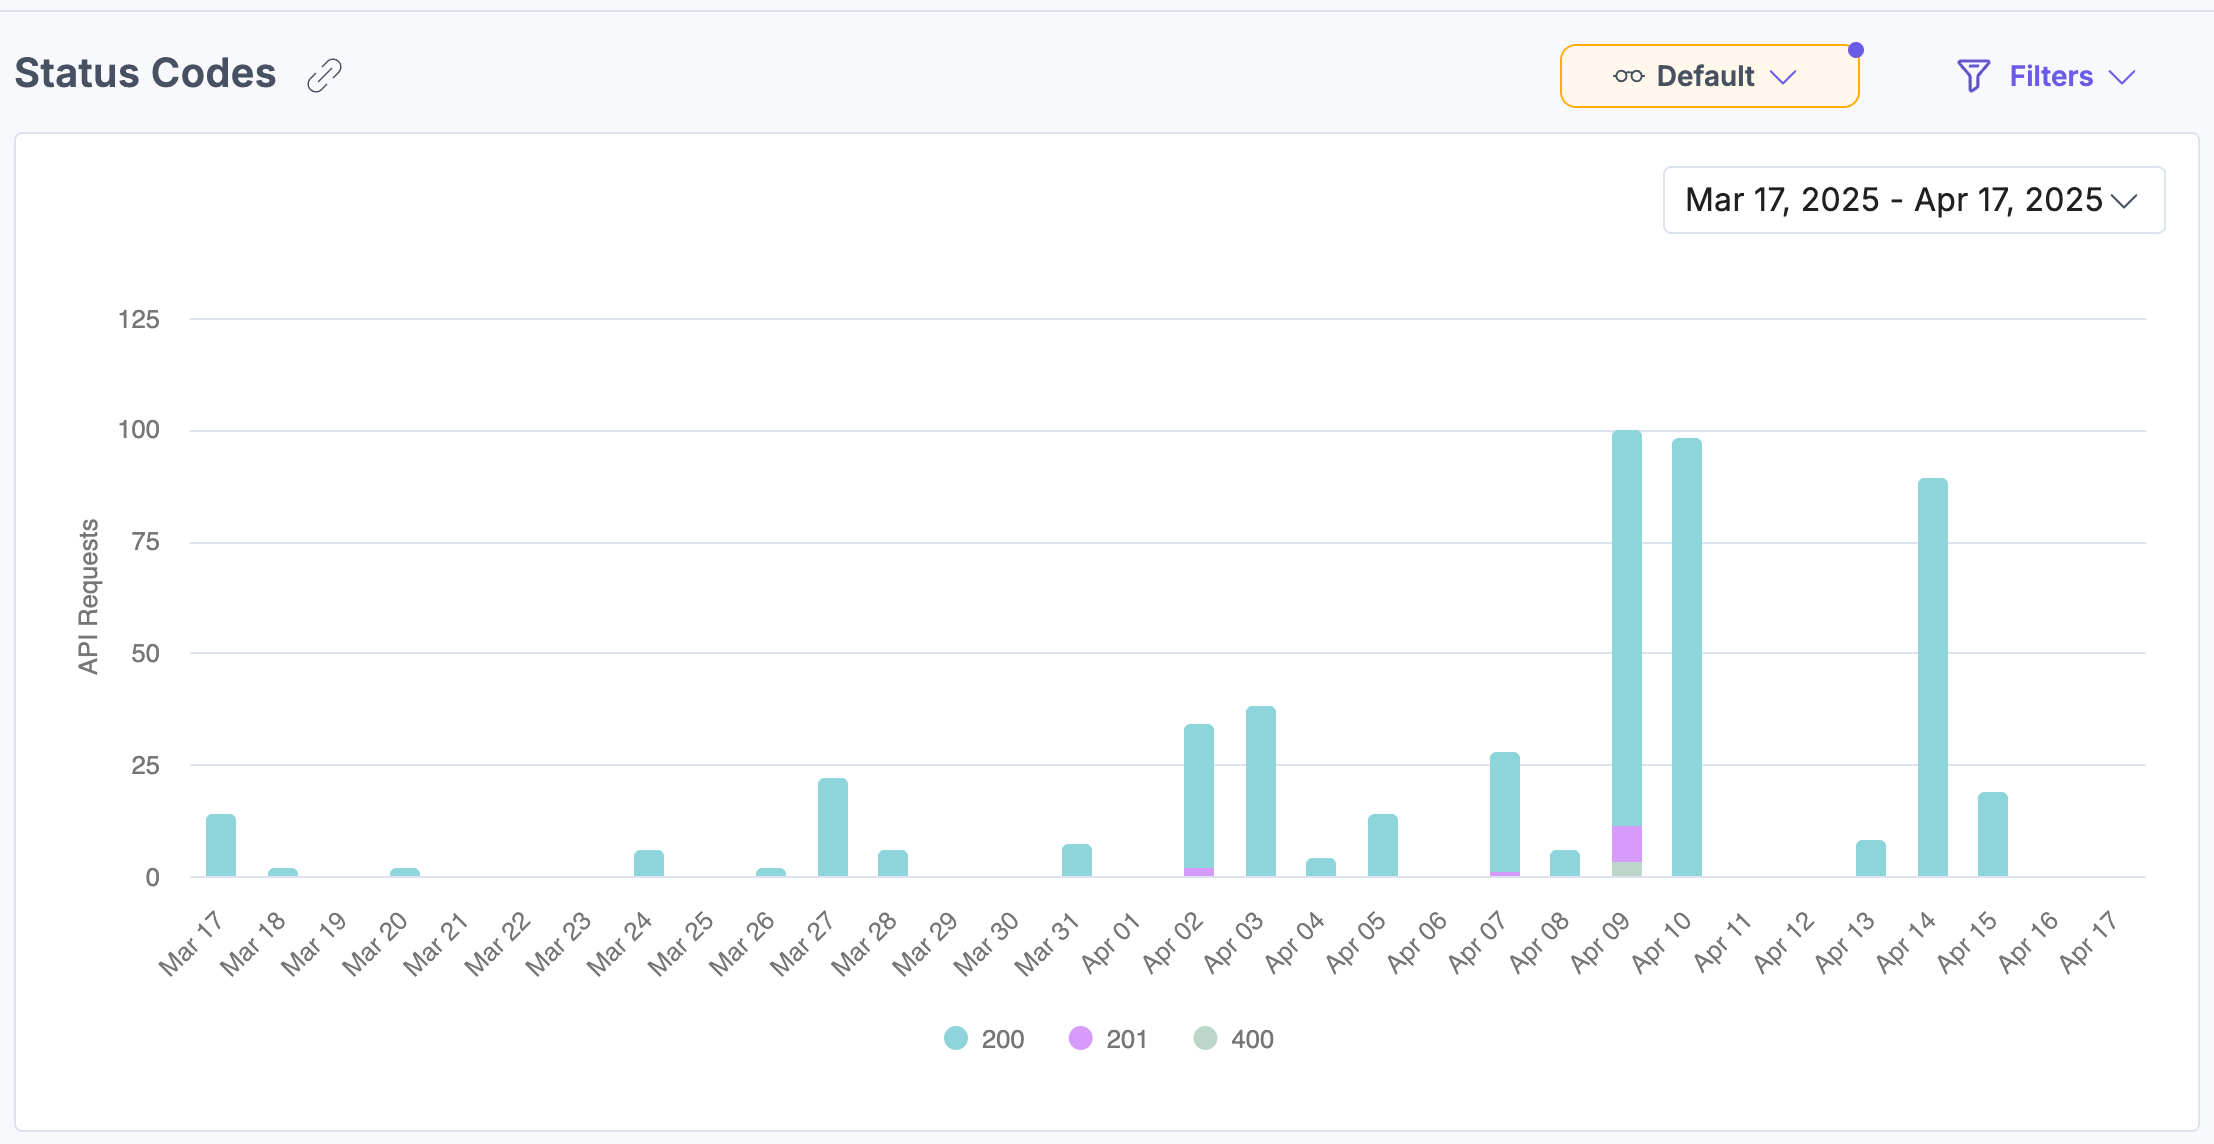
Status Codes
This section monitors the status of API calls, including successful requests, errors, and unsupported requests, to help you identify and address any issues quickly.
These sections give you insight into your automation performance, so you can make data-driven decisions to improve efficiency, optimize resource allocation, and keep your automation processes running smoothly.
Apply Filters and Manage Views
To apply filters, click Filters, select your option, then click Apply Filter(s).
The following filters are available:
- Status Code: Filter the chart to show only specific status codes.
- Group By: Organize the data by daily, weekly, or monthly intervals.
- Date Range: Choose from predefined time filters (1 week, 30 days (default), 60 days, or 90 days). Additionally, some sections include a date selector below the graph to refine the range within the last 90 days.
- Custom Date: Use the date dropdown filter to select a specific range or set a custom date range.
Note: The custom date range should not exceed 90 days.
To save a specific filter for later use, click the horizontal ellipsis (...) beside Reset and choose Save As New View.
Once saved, your view appears in the dropdown menu for quick access, so you don’t need to reapply filters manually each time.
Related Resources
