

Log Targets
The Log Target feature in Contentstack Launch enables you to forward logs to third-party monitoring services.
How Do Log Targets Work?
Logs flow through the following path:
Your App → Launch Edge/Server → Log Target → Your Observability Provider
When you create a Log Target, you choose which type of logs to forward:
- Server Logs: Runtime output from your SSR Applications, Cloud Functions, and Edge Functions.
- Traffic Logs: Request/response metadata from the CDN edge.
You can forward one or both data types per Log Target. This lets you control what each monitoring destination receives.
Log Data Reference
- Server Logs: Logs exactly as generated by your SSR Applications, Cloud Functions, and Edge Functions.
- Traffic logs: Traffic Logs include request/response metadata processed at the CDN edge. Each log entry contains the following fields:
| Field | Type | Description |
| IP | String | Client IP address making the request |
| EdgeTimestamp | ISO 8601 | Timestamp when the request was processed at the edge |
| Host | String | Hostname of the incoming request |
| Method | String | HTTP method (GET, POST, PUT, etc.) |
| URI | String | Request path and query string |
| EdgeResponseStatus | Integer | HTTP status code returned to the client (e.g., 200, 304, 404) |
| EdgeResponseBytes | Integer | Size of the response body in bytes |
| ClientRequestBytes | Integer | Size of the request body in bytes |
| EdgeColoCode | String | IATA code of the edge data center that served the request (e.g., BOM = Mumbai) |
| EdgeCacheStatus | String | Cache result: hit, miss, expired, bypass, dynamic |
| RequestDurationMs | Integer | Total time to process the request in milliseconds |
| Referrer | String | HTTP Referer header value, if present |
| HttpVersion | String | HTTP protocol version used (HTTP/1.1, HTTP/2, HTTP/3) |
| UserAgent | String | Full User-Agent string from the client |
| DeviceType | String | Detected device category: Mobile, Desktop, Tablet |
| OperatingSystem | String | Client's operating system (e.g., Android, iOS, Windows) |
| SourceBrowser | String | Client's browser name (e.g., Chrome, Safari) |
| SourceASN | String | Autonomous System Number and organization name of the client's network |
| SSLJA3Fingerprint | String | JA3 TLS fingerprint, used for identifying client TLS behavior |
| SSLJA4Fingerprint | String | JA4 TLS fingerprint, newer format, more granular client TLS identification |
Note: Server Logs are forwarded exactly as generated by your application. Launch does not modify, filter, or mask log content. If your logs contain sensitive information, ensure it is masked or removed at the source before export.
Setting Up a Log Target
- Track 1: Your provider already supports OTLP natively (Datadog, New Relic, Honeycomb, etc.) → No collector needed, just use your provider's endpoint and API key.
- Track 2: Your provider doesn't support OTLP (Splunk, custom setup, etc.) → You need to self-host an OTEL Collector.
Additional Resources:
- Learn more about hosting an OpenTelemetry(OTEL) Collector service in the OpenTelemetry Documentation.
- Refer to Host a Launch OTEL Collector Service exporting logs to AWS Cloudwatch to configure the OTEL Collector service.
| Provider | Protocol | Endpoint | Required Header | Header Value |
| Datadog | HTTP | https://otlp.<region>.datadoghq.com/v1/logs | dd-api-key | Your Datadog API key |
| New Relic | HTTP | https://otlp.nr-data.net/v1/logs | api-key | Your New Relic ingest key |
| New Relic | gRPC | otlp.nr-data.net:4317 | api-key | Your New Relic ingest key |
| Honeycomb | HTTP | https://api.honeycomb.io/v1/logs | x-honeycomb-team | Your Honeycomb API key |
| Honeycomb | gRPC | api.honeycomb.io:443 | x-honeycomb-team | Your Honeycomb API key |
| Grafana Cloud | HTTP | https://otlp-gateway-<region>.grafana.net/otlp/v1/logs | Authorization | Basic <base64(instance ID:apiKey)> |
| AWS CloudWatch | HTTP | https://logs.<region>.amazonaws.com/v1/logs | Authorization, x-aws-log-group, x-aws-log-stream | Bearer <token>, <log-group-name>, <stream-name> |
| Dynatrace | HTTP | https://<env-id>.live.dynatrace.com/api/v2/otlp/v1/logs | Authorization | Api-Token <token> |
| Axiom | HTTP | https://api.axiom.co/v1/logs | Authorization, x-axiom-dataset | Bearer <token>, <dataset> |
| Self-hosted OTEL | gRPC or HTTP | Your collector endpoint | Varies | — |
Note: The endpoint URLs and header details listed above are based on each provider's documentation at the time of writing. These may change over time — refer to your provider's official documentation for the most up-to-date configuration details.
Log Identification via service.name
Launch automatically sets a unique service.name OTLP resource attribute on every log entry to identify its source environment:
- Server Logs: launch-<environmentUid>
- Traffic Logs: launch-traffic-<environmentUid>
Use this field to filter and separate logs by environment inside your observability provider. For example, filtering by service name in Axiom, Datadog, New Relic, or Honeycomb. This is especially useful when sending logs from multiple environments to a single destination.
This step-by-step guide lets you create Log Targets in Contentstack Launch to forward your project logs to specific endpoints.
Prerequisites
- Contentstack account
- Access to Launch for your organization
- OTEL Collector service capable of receiving logs configured with TLS-secured gRPC/HTTP Endpoint
Steps for Execution
Create a Log Target
To create a Log Target, log in to Contentstack account and follow the steps:
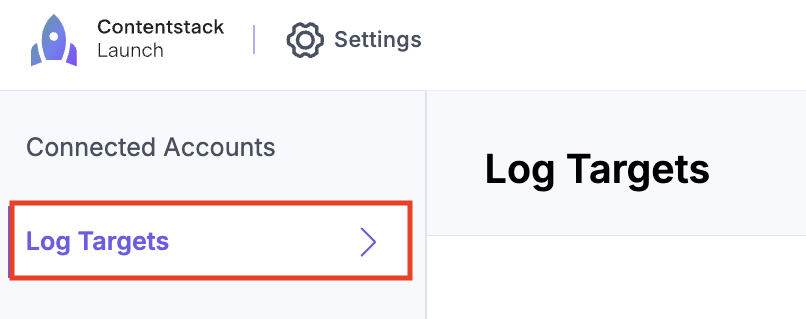
- Go to the “App Switcher” icon in the top-right corner and click Launch.
- Click the Settings icon and navigate to the Log Targets page.
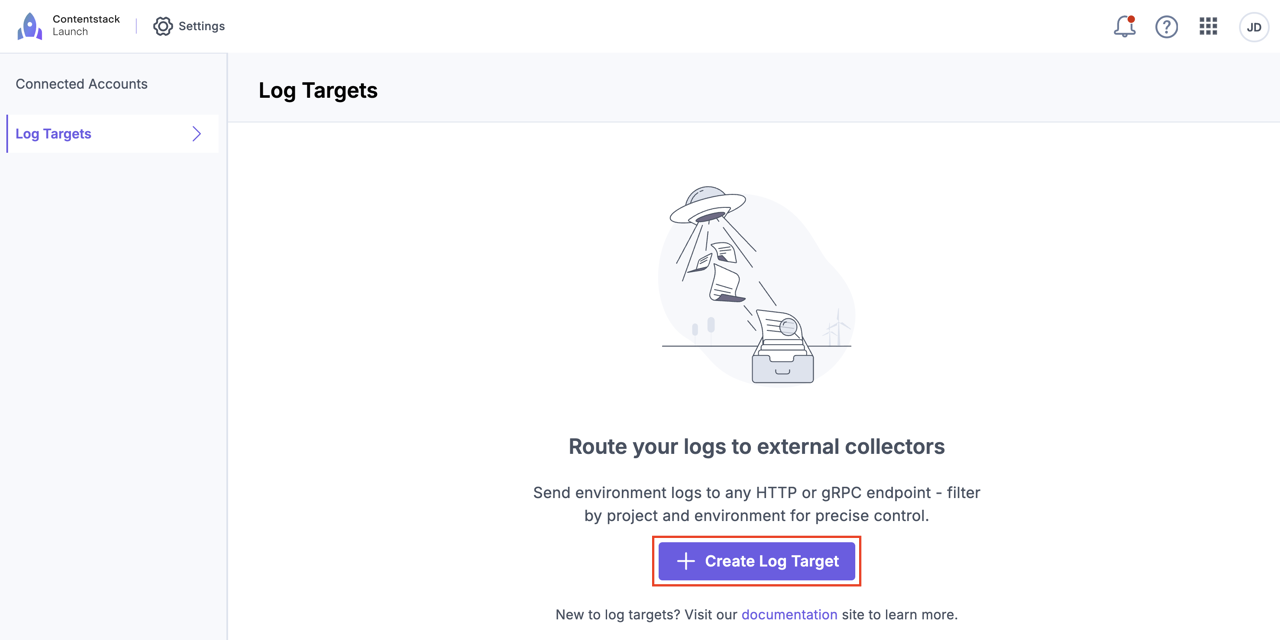
- Click the Create Log Target button to create a new Log Target.
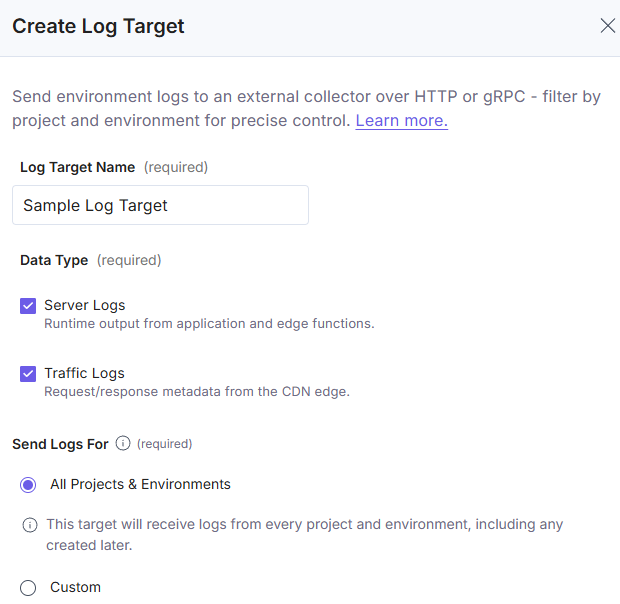
- In the modal that appears, enter the following:
- Log Target Name: A name for the Log Target.
- Data Type: Select one or both log types that the Log Target should forward. At least one is required:
- Server Logs: Runtime output from SSR Applications, Cloud Functions, and Edge Functions.
- Traffic Logs: Request/response metadata from the CDN edge.
- Send Logs For: Select the Launch projects and environments that should send logs to this Log Target. You have two options:
- All Projects & Environments: Sends logs from all current and future Launch projects and environments in your organization.
Only one Log Target can forward each data type organization-wide. The valid setups are:
- One Log Target forwarding both Server Logs and Traffic Logs.
- Two Log Targets with one forwarding Server Logs and one forwarding Traffic Logs.
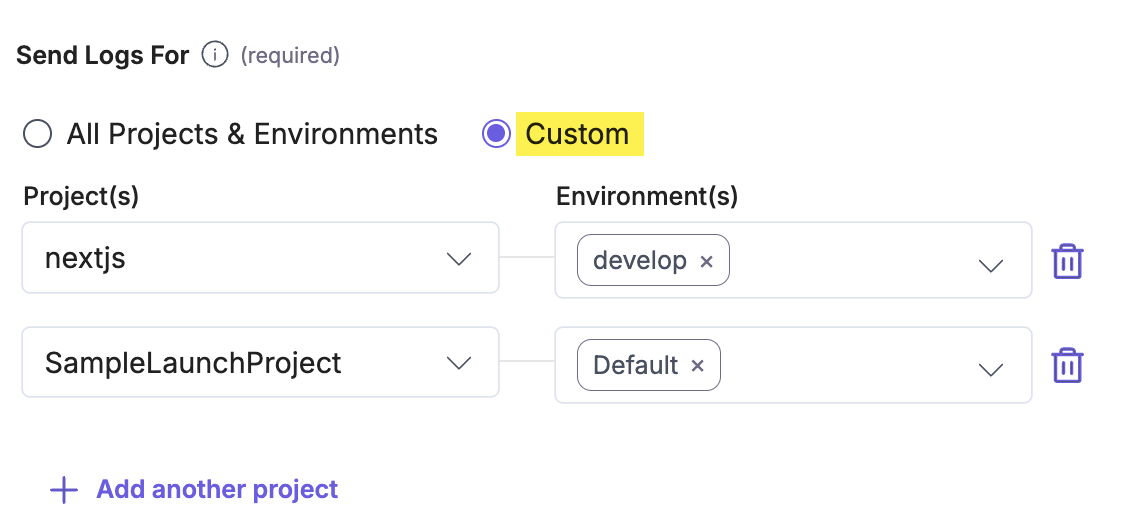
- Custom: To configure a Log Target for specific projects and environments, select the Custom option. Select your Projects and Environments from the respective dropdowns, then click Apply to configure the settings. Also, click + Add another project to add another set of projects and environments.
Uniqueness rule
Each environment and data type combination can be covered by only one Log Target. The same environment can send logs to multiple Log Targets, as long as each uses a different data type.
Examples:
- Target A covers env1 with Server Logs, and Target B covers env1 with Traffic Logs. This is allowed because both targets use the same environment but different data types.
- Target A covers env1 with Server Logs, and Target B covers env1 with Server Logs. This is blocked because the same environment and data type are already covered by another Log Target.
- Target A covers env1 with Server Logs, and Target B covers env2 with Server Logs. This is allowed because both targets use the same data type but different environments.
- A Log Target scoped to All Projects & Environments with Server Logs covers Server Logs across every environment. This means no other Log Target can use Server Logs for any environment while this Log Target exists.
Note: If existing Log Targets cover environments for a selected data type, the system disables the All Projects & Environments option for that data type when creating or editing a Log Target.
- All Projects & Environments: Sends logs from all current and future Launch projects and environments in your organization.
- Delivery Protocol: A protocol (gRPC or HTTP) used to forward logs to the required endpoint.
- Endpoint URL: The OpenTelemetry OTLP/gRPC/HTTP endpoint where logs are transmitted.
Note: For gRPC, do not include http:// or https:// prefix. For HTTP, the URL must begin with https:// and end with /v1/logs.
- Authentication & Headers: Headers required by your provider.
Example: Header name x-honeycomb-team, value your-api-key.
- Payload Format: The data format (JSON or Protobuf) used to send logs to your provider.
Note: The JSON option is only for HTTP. If you have selected gRPC as the protocol, the payload format is always Protobuf.
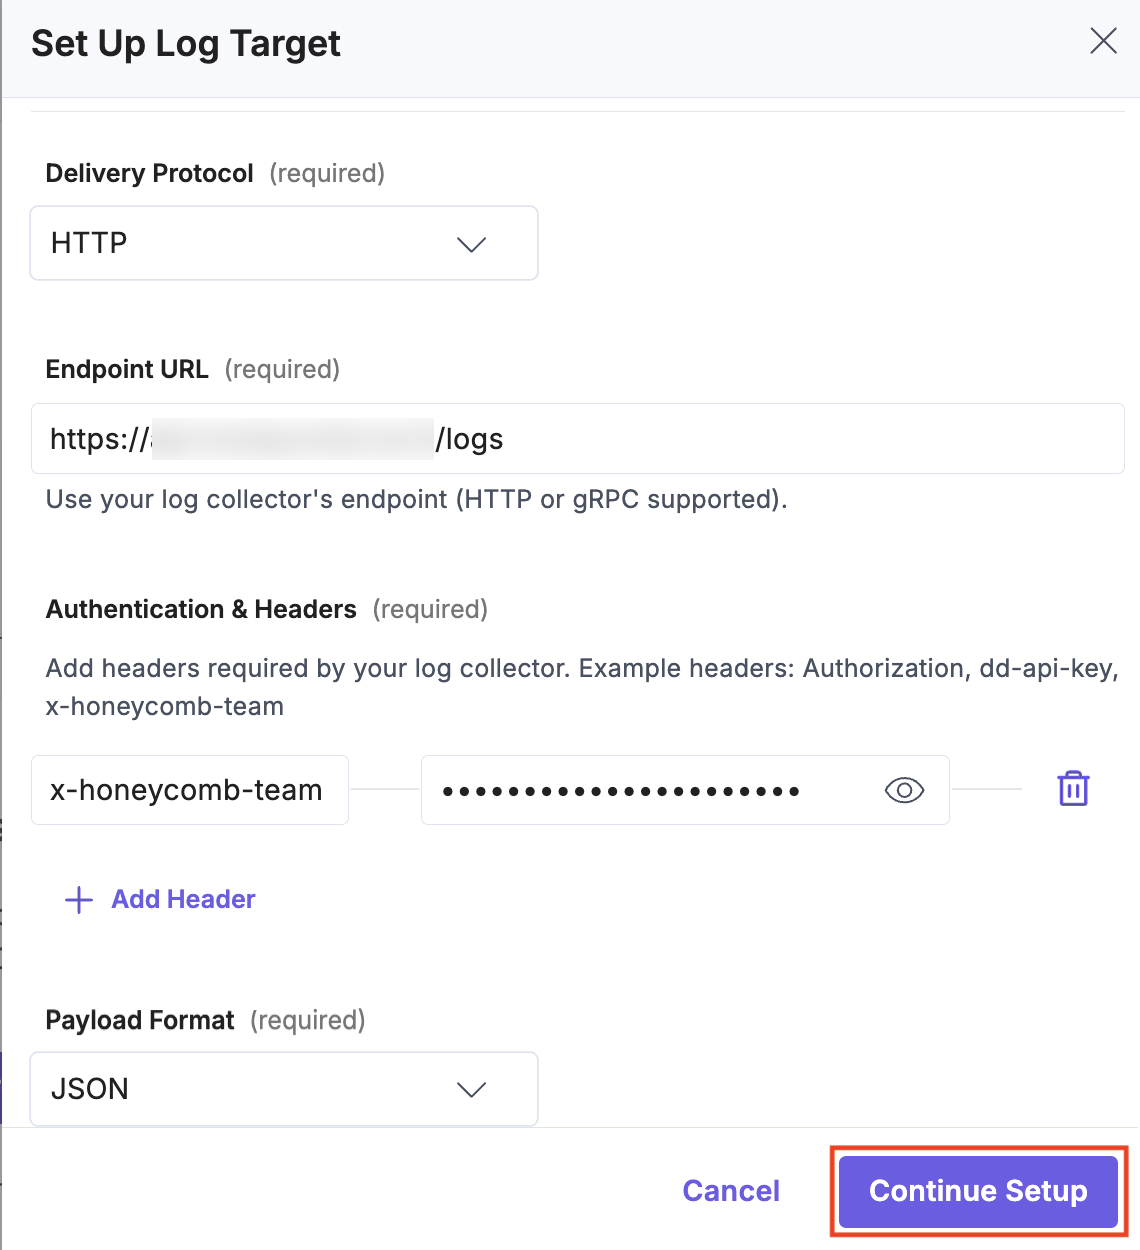
- Click the Continue Setup button.
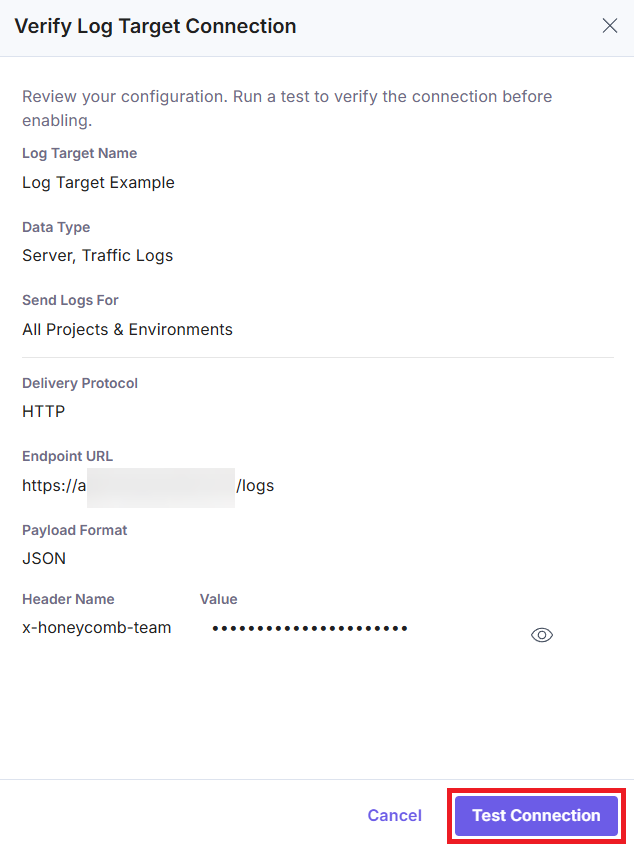
- In the modal that appears, perform one of the following:
- Verify the details and click the Test Connection button.
If the test is successful, the Log Target is created and configured to forward your project logs to the specified Endpoint URL. If the test fails, an error message appears. You can return to editing and update the Log Target configuration. - Click the Save Log Target button to save and verify later.
If you save the Log Target without testing it first, the system saves it in a disabled state. To enable the Log Target, you must verify it by testing the connection.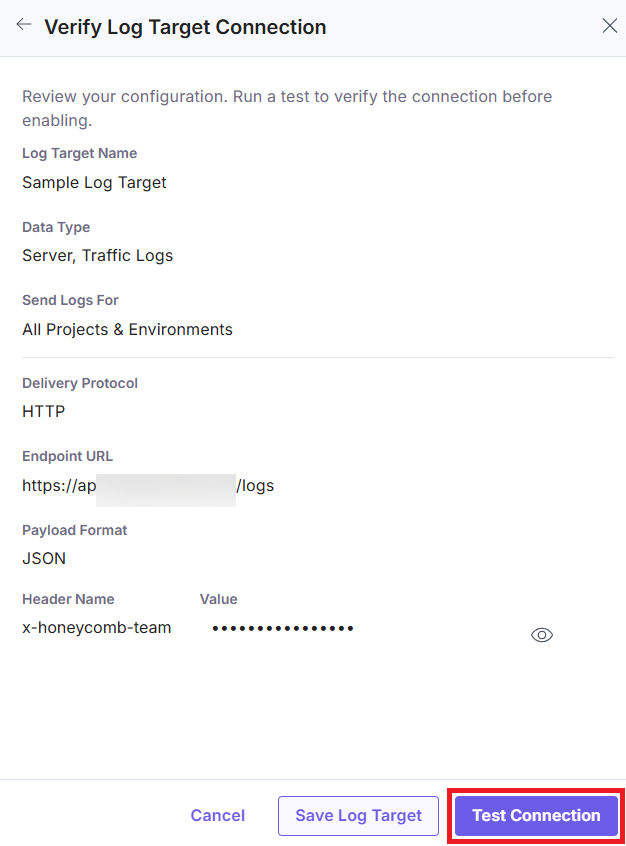
- Verify the details and click the Test Connection button.
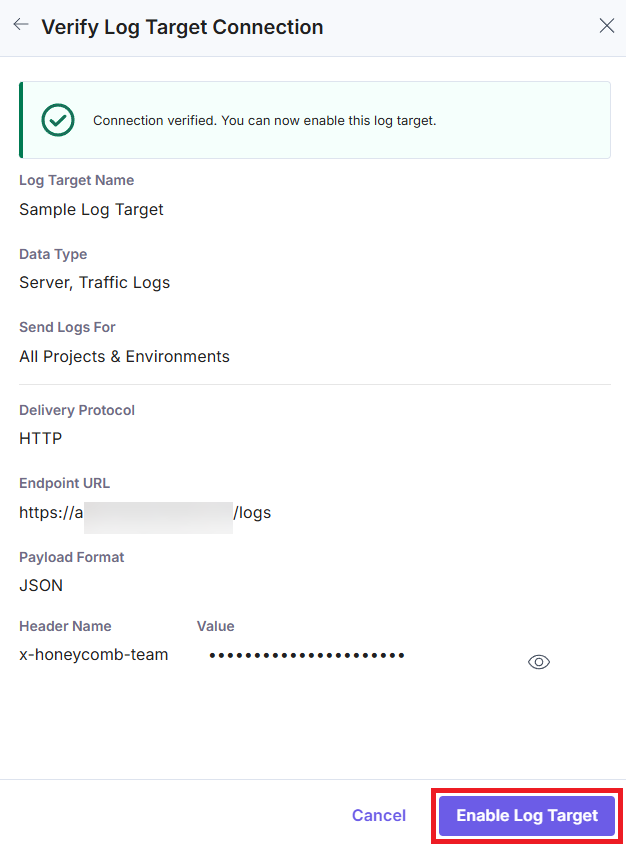
- Once verification is successful, click the Enable Log Target button to enable the Log Target and start forwarding logs.
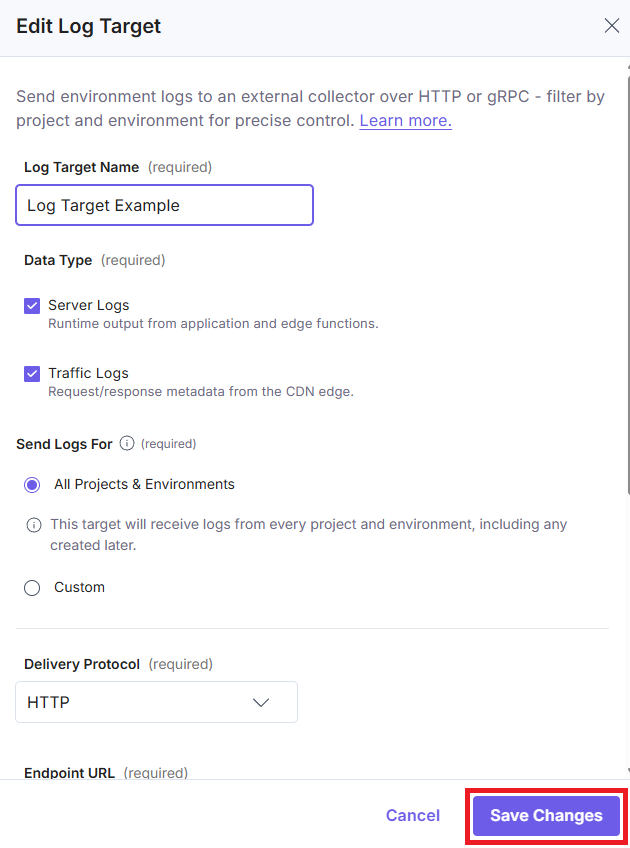
Edit a Log Target
Follow the steps below to edit a Log Target:
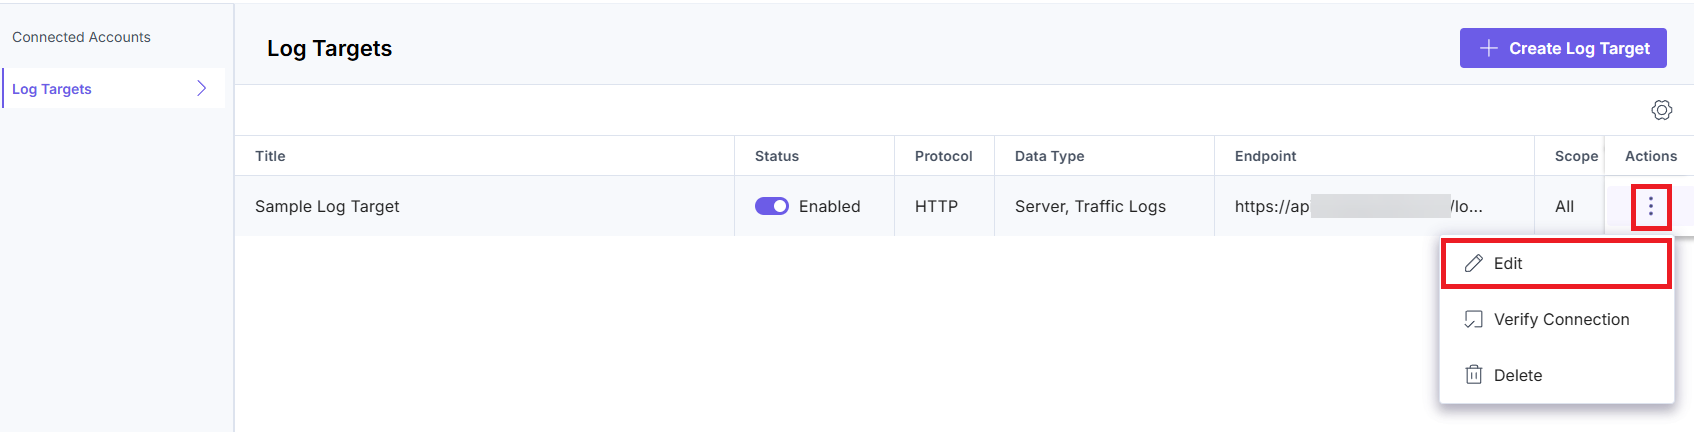
- Click the Settings icon and navigate to the Log Targets page.
- To edit a Log Target, click the vertical ellipses under Actions, and then select Edit.
- Edit the Log Target details as required and then click the Save Changes button to save the updated details.
Note: You can change the Data Type during editing. The change is subject to the same environment and data type uniqueness rule. If the selected data type is already covered by another Log Target, including All Projects & Environments Log Targets, the system blocks the change.
The Log Target is updated while in a disabled state.
Enable Log Target
To enable the Log Target, follow these steps:
- Click the toggle next to the Log Target you want to enable.
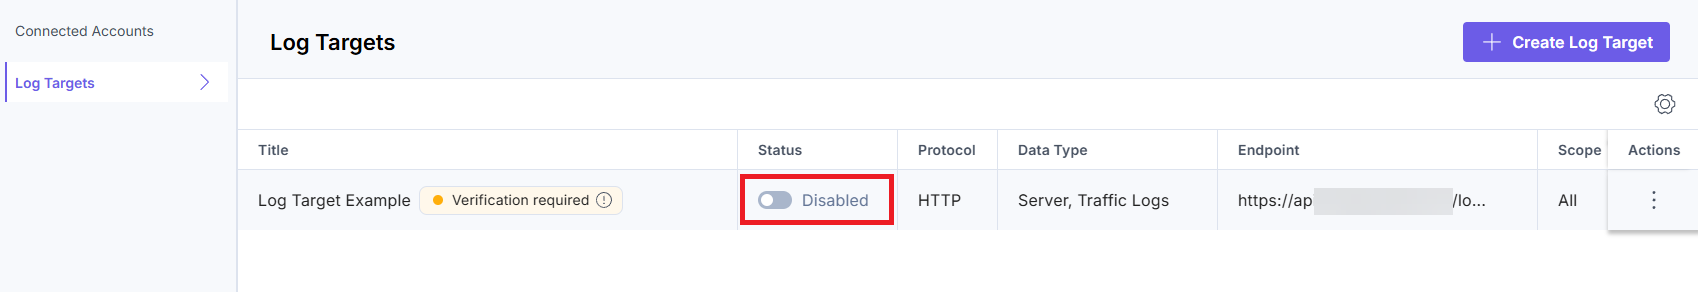
- After verifying all the details, click the Test Connection button on the Verify Log Target Connection modal.
- Once the connection is successfully verified, click the Enable Log Target button.
The Log Target is now enabled and ready to forward logs to your provider.
Verify the Connection
To verify the Log Target and test the connection, follow these steps:
- Click the Settings icon and navigate to the Log Targets page.
- Next to the Log Target you want to verify, click the vertical ellipses under Actions, then select Verify Connection.
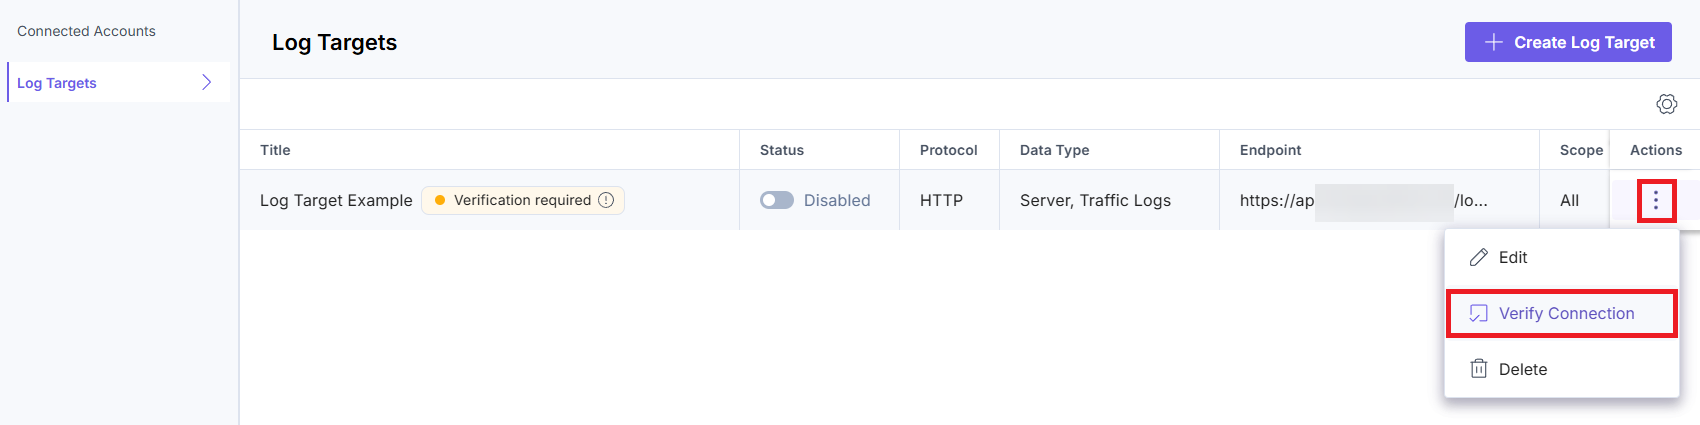
- Verify the details, and click the Test Connection button in the Verify Log Target Connection modal.
This confirms whether your Log Target is ready to receive logs.
Note: To verify the connection to your endpoint, Launch sends a test log that may be visible in your observability tool.
Delete a Log Target
Follow the steps below to delete a Log Target:
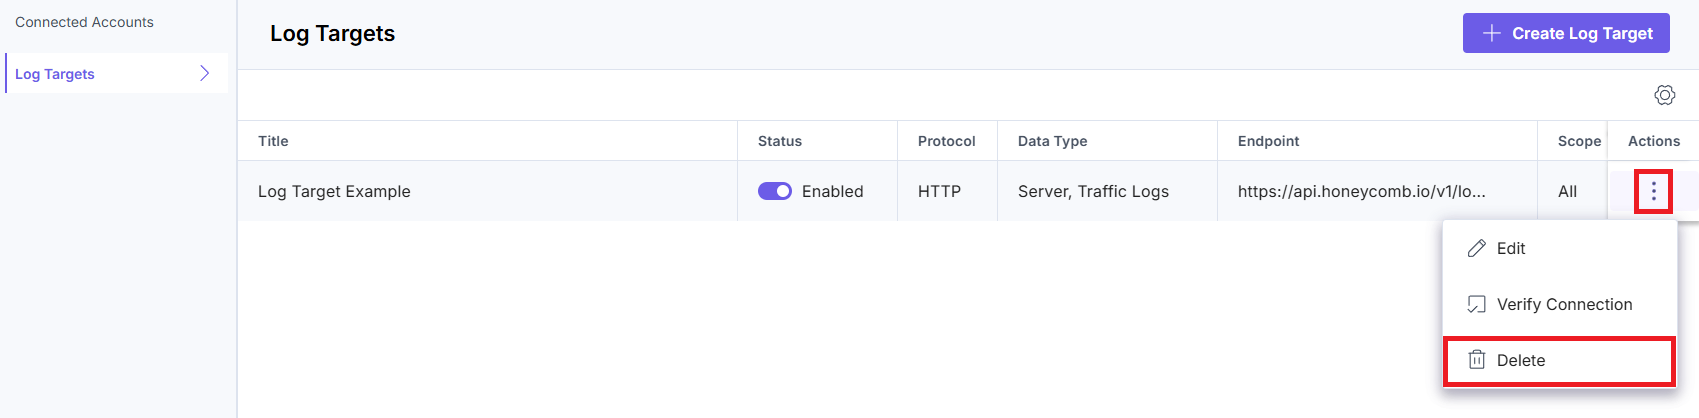
- Click the Settings icon and navigate to the Log Targets page.
- To delete the Log Target, click the vertical ellipses under Actions, and then click Delete.
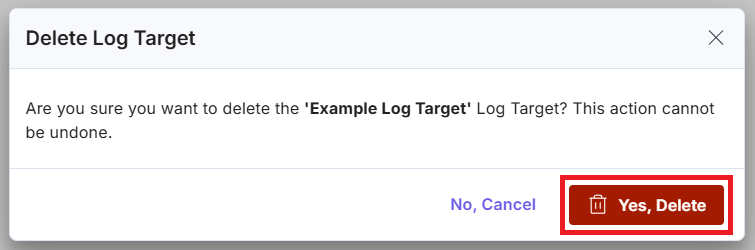
- In the modal that appears, click the Yes, Delete button to delete the Log Target.
Additional Resources: Use this GitHub repository as an example to set up a TLS-secured OTLP/gRPC endpoint that receives and exports logs to CloudWatch.
Troubleshooting
| Symptom | Likely Cause | Fix |
| Endpoint validation error on Grafana | Endpoint path must be /otlp/v1/logs, not /v1/logs | Update endpoint to match the exact path |
| gRPC endpoint rejected | https:// prefix included in gRPC endpoint | Remove the protocol prefix for gRPC endpoints |
| Test connection fails | Wrong header name or value | Double-check the header key-value against your provider's API key settings |
Limitations
- You can create a specific number of Log targets. If you want to raise the limit, contact Contentstack support.
- Launch can forward only up to 1000 logs in a single request.
- Launch supports a log line size of up to 64 KB per line.
- Launch supports a total log size of up to 1 MB per request.
More articles in "Launch Features"
